
If you’ve spent time studying technical analysis, you’ve probably heard about Fibonacci Retracement. Many traders treat it like a set of “magic numbers” where prices are “supposed” to stop and reverse direction.
But let’s be real: technical analysis isn’t magical, the market doesn’t follow strict rules, and Fibonacci isn’t a crystal ball that predicts the future.
So, if you’ve tried to use Fibonacci to find the “perfect” entry and exit points but ended up confused and frustrated, you’re not alone. The problem isn’t Fibonacci itself — it’s the way most traders use it.
Here at Trading Busters, we do things differently. We don’t use Fibonacci to guess support and resistance levels. We use it for something much more useful: quick and efficient calculations.
Let’s see how this works!
What is Fibonacci Retracement and How Does it Work?

Before diving into how we use Fibonacci, let’s quickly go through what it is and how most traders use it.
Simple Explanation of the Fibonacci Sequence
Fibonacci Retracement is based on the Fibonacci Sequence, a series of numbers where each number is the sum of the two numbers before it:
0, 1, 1, 2, 3, 5, 8, 13, 21, 34, 55, 89…
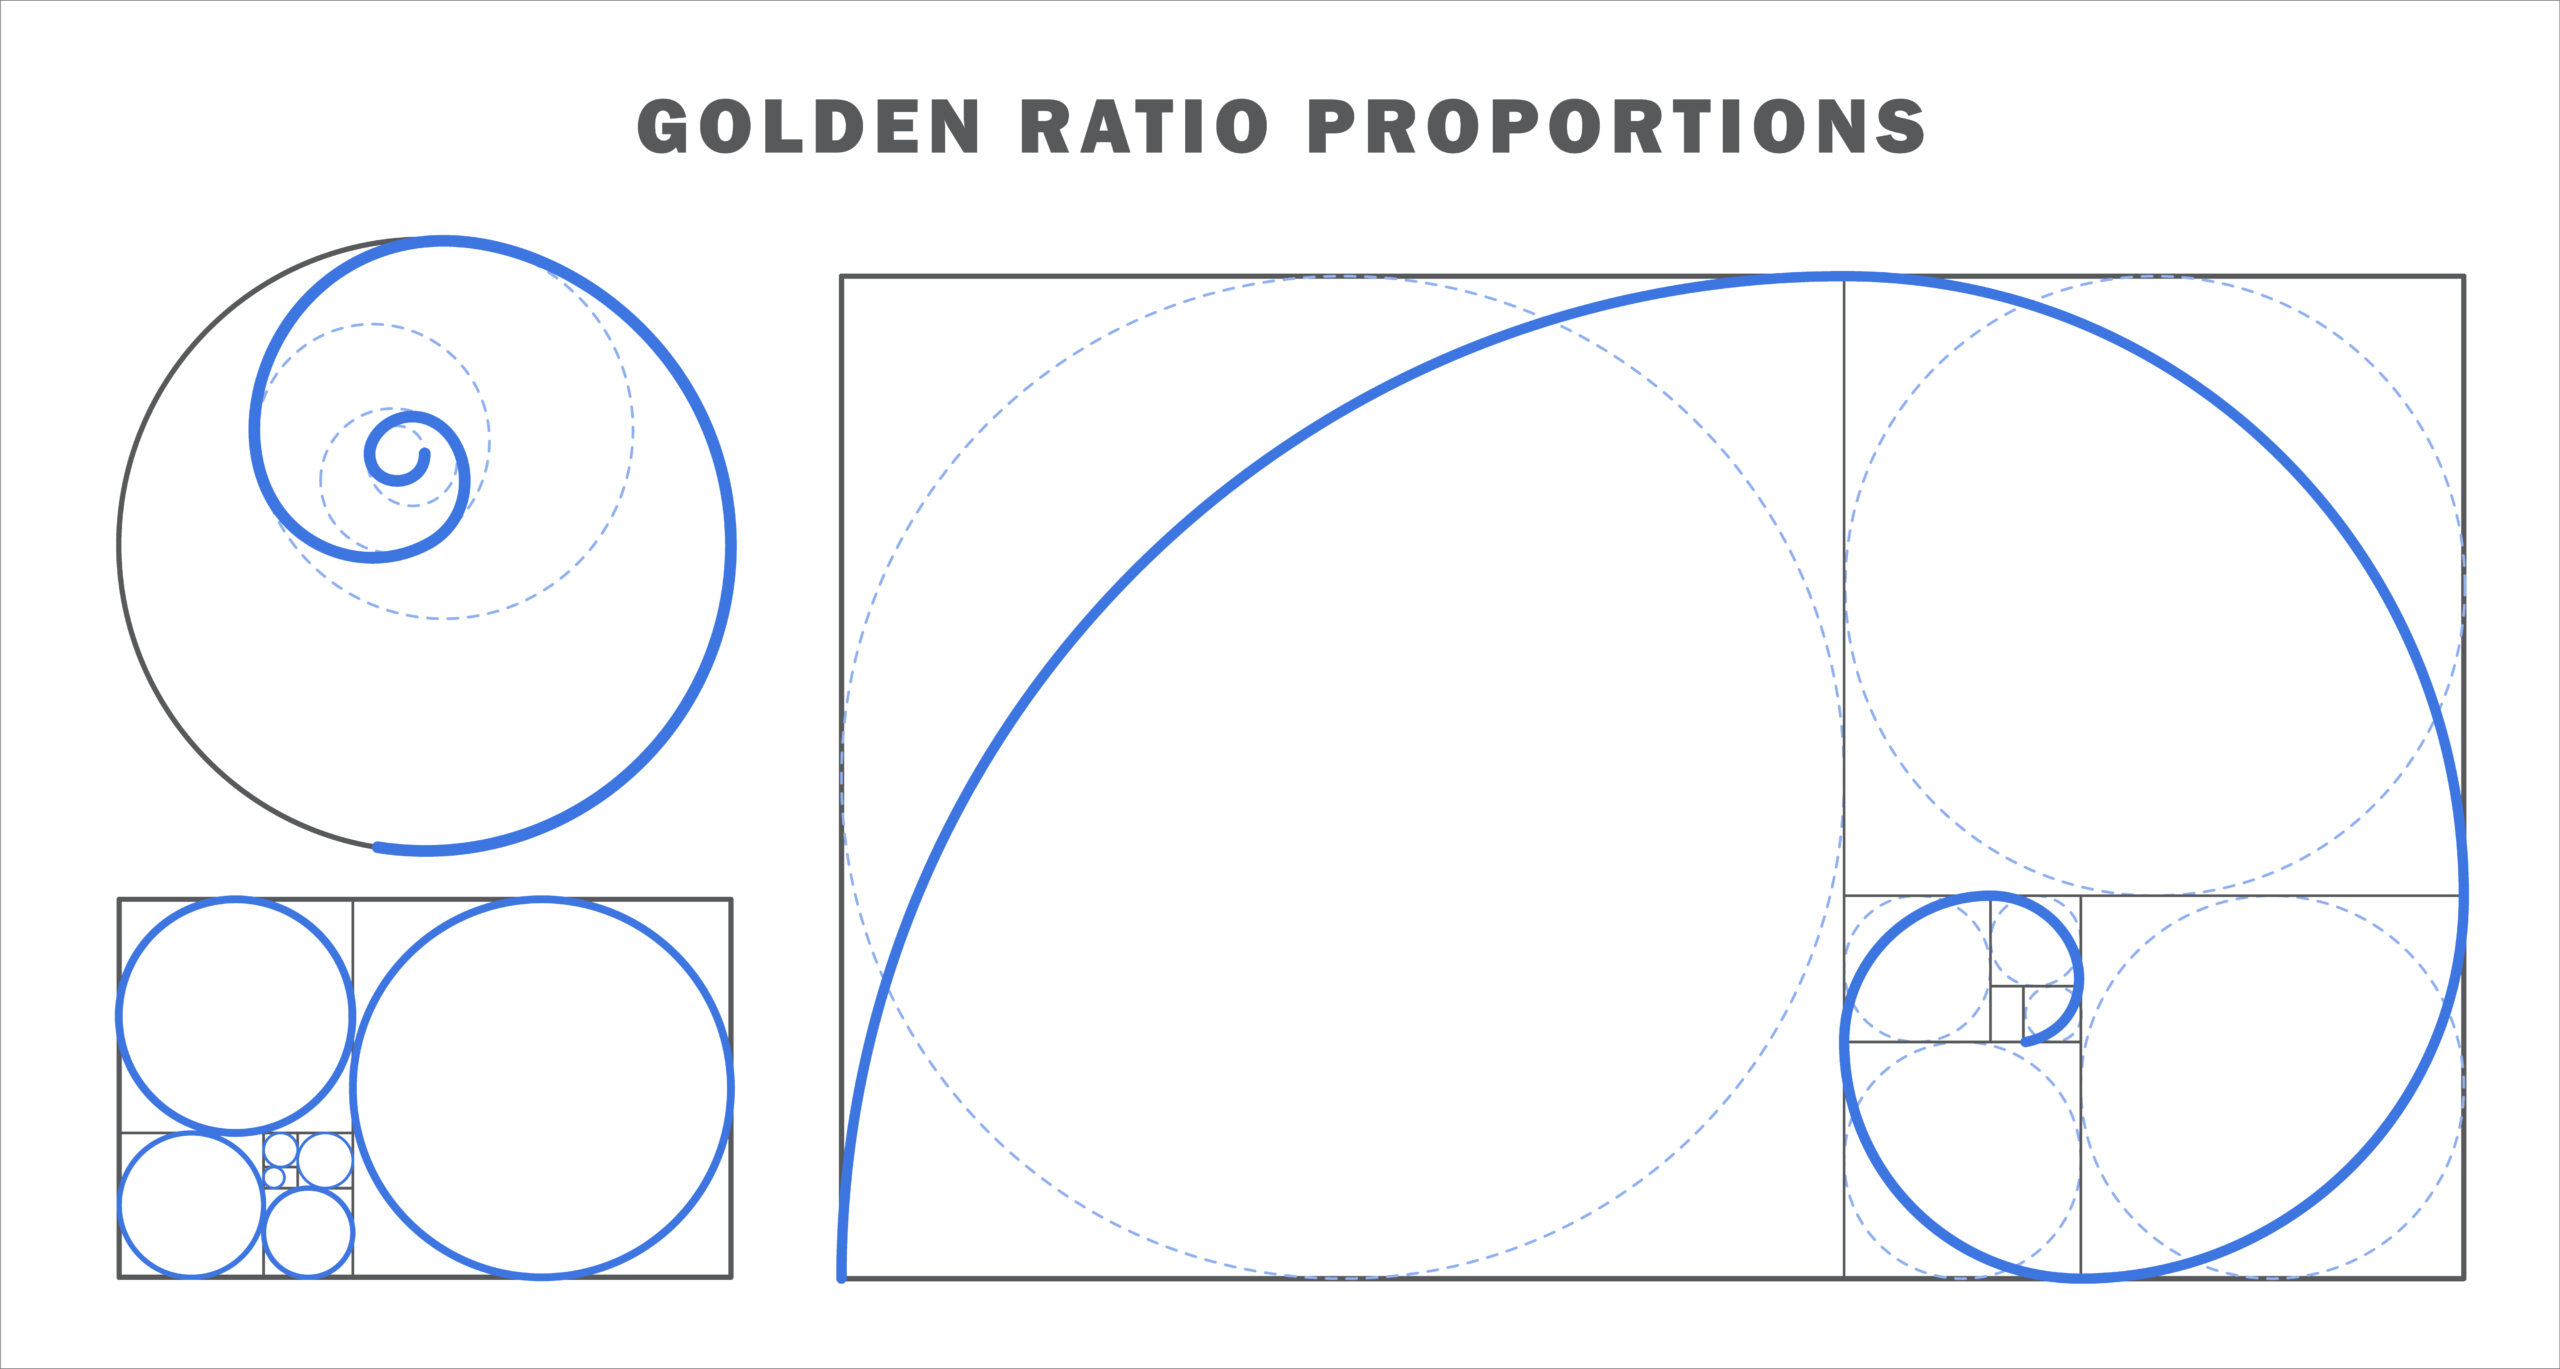
The interesting thing about this sequence is that, as you move forward, the ratio between a number and the one before it approaches 1.618, also known as the “Golden Ratio.”
This ratio appears everywhere—in nature, architecture, art, and even financial markets.
Important Fibonacci Retracement Levels: 23.6%, 38.2%, 61.8%
Traditional traders take this sequence and use certain percentages to draw levels on a chart:
- 23.6%
- 38.2%
- 50% (not a Fibonacci number, but traders consider it important)
- 61.8% (Golden Ratio)
- 100%
How Do Most Traders Use It?
They draw these levels between an important high and low on the chart. They say that if the price pulls back to a Fibonacci level, it’s a good spot where it might reverse and continue in the trend direction.
The problem?
These levels don’t always work. Sometimes the price respects them, other times it completely ignores them — and that’s perfectly normal. Traders who rely solely on these levels often make mistakes and lose money.
So, let’s see how we use Fibonacci at Trading Busters—and how you can use it effectively too.
How to Identify Fibonacci Trading Zones
If you’ve ever tried using Fibonacci levels and felt confused about where to place them, you’re not alone.
Many traders make these common mistakes:
- They draw Fibonacci from random highs and lows.
- They believe these levels are “sacred lines” the price must respect.
- They rely only on Fibonacci without using other tools or strategies.
So, here’s how we use it — and how you can use it too for better results:
1. Finding Important Highs and Lows
The first step is correctly identifying reference points — the important highs and lows in the market.
What most traders do:
- They choose any recent high and low and then wonder why Fibonacci doesn’t work.
What we do:
- We pick highs and lows that clearly show market direction changes, not minor fluctuations.
How to identify highs and lows correctly?
In an uptrend:
- Find a clear low followed by a strong upward move.
- Find a clear high where the price hits resistance.
In a downtrend:
- Find a clear high followed by a strong downward move.
- Find a clear low where the price hits support.
For example:
If the price moves up clearly by 200 pips, then pulls back, you can use that clear high and low as reference points.
If it’s just a small 20-30 pips movement, there’s no point using Fibonacci—it’s not significant enough.
2. Drawing Fibonacci Levels Correctly
Once you have clear highs and lows, you need to draw Fibonacci correctly.
What most traders do:
- They draw Fibonacci randomly without paying attention to the trend direction.
- They ignore overall market movements.
- They rely only on standard levels (23.6%, 38.2%, 61.8%).
What we do:
- We draw Fibonacci only on clear, significant moves.
- We use the 50% retracement level as an important reference.
- We combine Fibonacci with other elements, like our Statistics & Probabilities concept.
How to draw Fibonacci correctly?
For an uptrend:
- Find the significant low (where the upward move starts).
- Find the significant high (where the price meets resistance).
- Draw Fibonacci from low to high.
For a downtrend:
- Find the significant high (where the downward move starts).
- Find the significant low (where the price finds support).
- Draw Fibonacci from high to low.
For example:
If an asset price moves from 1.1000 to 1.1500:
- Drawing Fibonacci from 1.1000 (low) to 1.1500 (high) gives levels like 1.1380 (23.6%), 1.1300 (38.2%), 1.1250 (50%), and 1.1180 (61.8%).
- If the price pulls back to 1.1250 (50%) and starts moving up again, it might be a good sign for a buy trade.
But again, don’t rely only on Fibonacci. That’s where confirmation comes in.
3. Confirming Support and Resistance Zones
Once you’ve drawn Fibonacci, you must see if these levels are actually important for the market.
What most traders do:
- Enter trades immediately when the price reaches 61.8%.
- They don’t check if Fibonacci levels match other signals.
- They trade solely based on Fibonacci numbers.
What we do:
- We make sure Fibonacci levels align with other important zones.
- We confirm the levels by looking at price action.
- We consider the overall market context.
How to properly confirm Fibonacci levels?
Step 1: Look for confluence with other important zones
A Fibonacci level is more powerful if it aligns with:
- Past support or resistance.
- Pivot points.
- Important moving averages (like EMA 50 or EMA 200).
- High-volume trading areas.
Step 2: Watch the price reaction
- If the price hits a Fibonacci level and shows a reversal pattern, it’s a strong confirmation.
- If the price easily breaks through the Fibonacci level, it’s not relevant, and you should wait for another opportunity.
Step 3: Consider market volatility and session times
- Sometimes the price breaks Fibonacci levels during high-volatility sessions (e.g., New York session). This doesn’t mean the level isn’t valid — it just means you need to consider market conditions.
What’s Next?
Now you know how to identify correct highs and lows, draw Fibonacci properly, and confirm the levels.
But that’s not all.
In the next part of this guide, we’ll talk about combining Fibonacci with proper risk management, using Fibonacci for high-probability trades, and common mistakes you should avoid at all costs.
Want to learn more? Keep reading!
Practical Trading Strategies with Fibonacci
Now that you know how to draw Fibonacci levels correctly and confirm support and resistance areas, let’s get to the really important stuff: using Fibonacci to make profitable trades.
You could have all the levels drawn perfectly, but if you don’t know how to use them properly, you’ll keep losing money. That’s why having a clear strategy is so important.
Here are three simple but effective strategies you can use in forex, crypto, stocks, or commodities.
Entering Trades at 38.2% Pullbacks
The 38.2% retracement level is popular, especially in markets with strong trends.
When the price moves up or down strongly, it usually pulls back a bit before continuing its original move. But not every pullback is a good entry. That’s where Fibonacci helps.
If the price pulls back to exactly 38.2% and shows signs of continuing the original trend, you have a solid trading opportunity. Why? Because big traders, investment funds, and trading robots often enter trades at this level.
Example: Say the price of something goes from 1.2000 up to 1.2500. Then it begins pulling back. You draw Fibonacci levels. If the price touches 1.2315 (38.2%) and you see positive signs like reversal candlesticks or increasing volume, this is a good entry point.
Many traders make the mistake of waiting for bigger pullbacks, missing out on quick moves. In strong markets, 38.2% is often enough for the price to continue its trend.
The Golden Pocket (61.8% – 65%)
If the 38.2% level is for strong, fast-moving trends, the 61.8% – 65% zone, known as the “Golden Pocket,” is for deeper pullbacks.
Professional traders love this zone because it offers better risk-to-reward ratios.
Instead of jumping in at 38.2%, you wait patiently for a deeper pullback (61.8%-65%), giving you a better chance to catch a solid reversal.
Why does this work? Because it’s a strong psychological area. Traders who missed the first move often try to enter here. Plus, big investors and algorithms also use this level.
Example: If the price rises from 1.2000 to 1.2500 and then pulls back, you draw Fibonacci levels. If the price hits around 1.2180 (61.8%) or 1.2150 (65%) and shows strong reversal signs (like pin bars, higher volume, or changing momentum), you have a near-perfect entry point.
The difference between this strategy and the 38.2% strategy is you get clearer confirmation — but you need more patience, as prices won’t always hit this deeper level.
Combining Fibonacci with Technical Indicators
Even if you draw perfect Fibonacci levels, don’t rely on them alone. You should always confirm with other signals before entering trades.
One great way to confirm is combining Fibonacci with other indicators like Moving Averages, RSI, or volume.
If a Fibonacci level matches another trading signal, the chance of the price reacting is much higher.
Example: If the price reaches the 61.8% retracement, and the 50-period exponential moving average (EMA 50) runs right through that level, this is extra confirmation the price could hold as support.
Another example: if the price hits a 50% retracement and the RSI indicator shows oversold conditions, you have a stronger argument to go long (buy).
Also, if volume increases exactly at a Fibonacci level, it shows that other traders also see and react to that level.
Combining signals helps you make smarter, safer trading decisions instead of relying only on lines on a chart.
These three strategies — entries at 38.2%, the Golden Pocket (61.8%-65%), and confirming levels with indicators — are key to correctly using Fibonacci. If you use them properly, you’ll have more precise, profitable trades with lower risk.
Next, let’s discuss how to protect your money with proper risk management when trading with Fibonacci.
Managing Risk in Fibonacci Trading

No matter how good your entry strategies are, without a solid risk management plan, you won’t last in trading.
Smart traders don’t just ask “Where do I enter?” They also ask, “Where do I exit if things go wrong?”
Two key elements that keep you safe long-term are the stop-loss and position sizing.
How to Set a Stop-Loss Using Fibonacci Levels
A stop-loss is your safety net. It protects you from big losses if the trade doesn’t go your way.
The simplest method is to set your stop-loss slightly below (for long trades) or above (for short trades) the Fibonacci level you used for entry.
Examples:
- If you enter long at a 38.2% retracement, place your stop-loss just below the 50% or 61.8% levels.
- If you enter at the Golden Pocket (61.8%), your stop-loss should be just below the 78.6% retracement.
Why? Because if the price strongly breaks these levels, your idea is probably wrong, and the market might change direction.
Mistakes to Avoid:
- Don’t set a stop-loss too tight just to limit losses—you might get stopped out too early.
- Never trade without a stop-loss! That’s a guaranteed recipe for disaster.
Your stop-loss should be logical and based on market structure, not just randomly placed.
Position Sizing for Controlled Risk
A stop-loss alone isn’t enough. Make sure the amount you could lose is acceptable.
The golden rule: Never risk more than 1-2% of your account on a single trade.
How to calculate your position size:
- Decide how much money you’re okay losing. (Example: If you have $10,000 and want to risk 1%, that’s $100.)
- Figure out how far your entry is from your stop-loss. (Example: 50 pips)
- Divide your total risk by the number of pips. (With $100 risk and 50 pips stop-loss, you can trade $2 per pip.)
Why this calculation matters:
- It keeps your risk under control, no matter how volatile the market is.
- The biggest mistake beginner traders make is entering trades that are too big, hoping for quick profits, and ending up blowing their account.
- A pro trader thinks long-term and avoids chasing huge profits from a single trade.
Fibonacci: Powerful Only if Used Correctly

Fibonacci isn’t a magic solution guaranteeing profits. But it’s extremely valuable if used right.
As you’ve learned, many traders use Fibonacci incorrectly, thinking they’ve found magic numbers.
At Trading Busters, we use Fibonacci differently:
- We don’t believe in “predictions” or fixed levels.
- We use Fibonacci for quick calculations and smart order placements.
- We combine Fibonacci with other market conditions, never relying on it alone.
- We use it for efficiency and precision—not as our only strategy.
If you apply what you’ve learned here, you’ll understand how markets move much better and make smarter trading decisions.
About Trading Busters — Why Are We Different?
If you’re here, you probably want more from trading. You don’t just want strategies copied from the internet — you want a clear, logical way to understand the market.
That’s exactly what we do at Trading Busters.
We teach you to think like a professional trader instead of blindly following meaningless rules.
If you want to learn more about our methods and join our community of top traders, follow us on Telegram and see how we can transform your trading.
We don’t promise overnight riches, but we guarantee you’ll learn how to trade properly and efficiently, without nonsense and unnecessary losses.